How Zabbix HA Really Works: No VIP, No Heartbeat, Just the Database

Introduction

High availability (HA) has been supported in Zabbix since version 6.0,
but I had never actually tested it myself.

According to most online information, Zabbix HA only provides redundancy
for the Zabbix server process itself.
It does not include database redundancy or VIP-based failover.

In the past, I built a Zabbix cluster using Pacemaker and DRBD back in the
Zabbix 2.0 era.
This time, I decided to test how the built-in HA feature really works in practice.

Many articles explain how to enable Zabbix HA.
However, very few explain what actually happens internally
when a failover occurs.

In this article, I focus on the actual behavior observed
during testing, rather than configuration steps.

Although Zabbix HA has been available since version 6.0, many explanations
still implicitly assume traditional HA concepts such as VIPs or heartbeat
communication between nodes.

By isolating the web frontend and closely observing failover behavior,
this article clarifies what Zabbix HA actually does — and what it does not do.

Test Environment

OSRocky Linux 9
Zabbix version7.4
Number of nodes2 (EC2 Instances)
Web server deploymentSeparated from Zabbix servers
(EC2 Instance/Apache)
DatabaseAmazon Aurora and Amazon RDS
(MySQL Community Edition)

Initial Assumptions

Before testing Zabbix HA, I assumed that the Zabbix Web frontend
communicates directly with the active Zabbix server.
However, after testing, I found that this assumption was incorrect.

Why I Separated the Web Server

In most Zabbix deployments, the web frontend is installed on the same
host as the Zabbix server.
Because of this, the actual behavior of the HA feature is not always
easy to observe.

To better understand how Zabbix HA really works, I decided to separate
the web server from the Zabbix servers and test the behavior in this setup.

What I Observed

Instead, I observed the following:

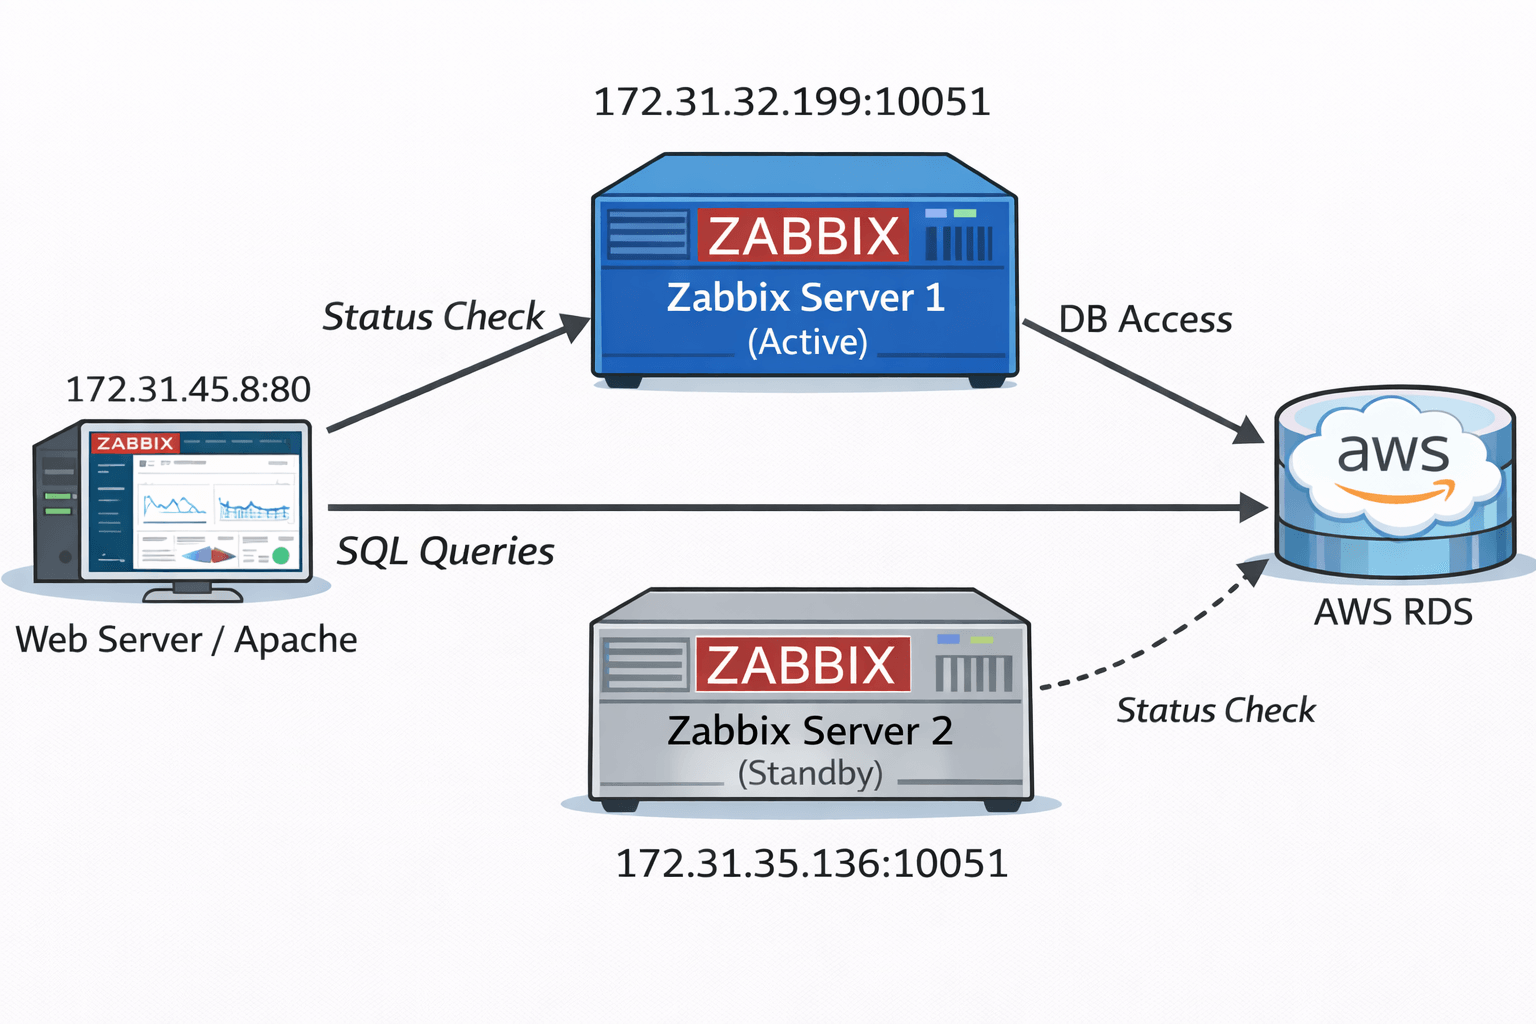
  • The HA feature provides redundancy only for Zabbix server processes.
    As a result, if web server redundancy is not required,
    a single web server is sufficient.
  • The Zabbix Web frontend accesses the database directly to retrieve data.
  • The Zabbix Web frontend dynamically follows the active Zabbix server
    when displaying server status.

The following diagram summarizes the actual communication flow
observed during testing.

Figure 1: Zabbix HA architecture observed during testing.
No VIP or heartbeat is used; coordination is done entirely via the database.

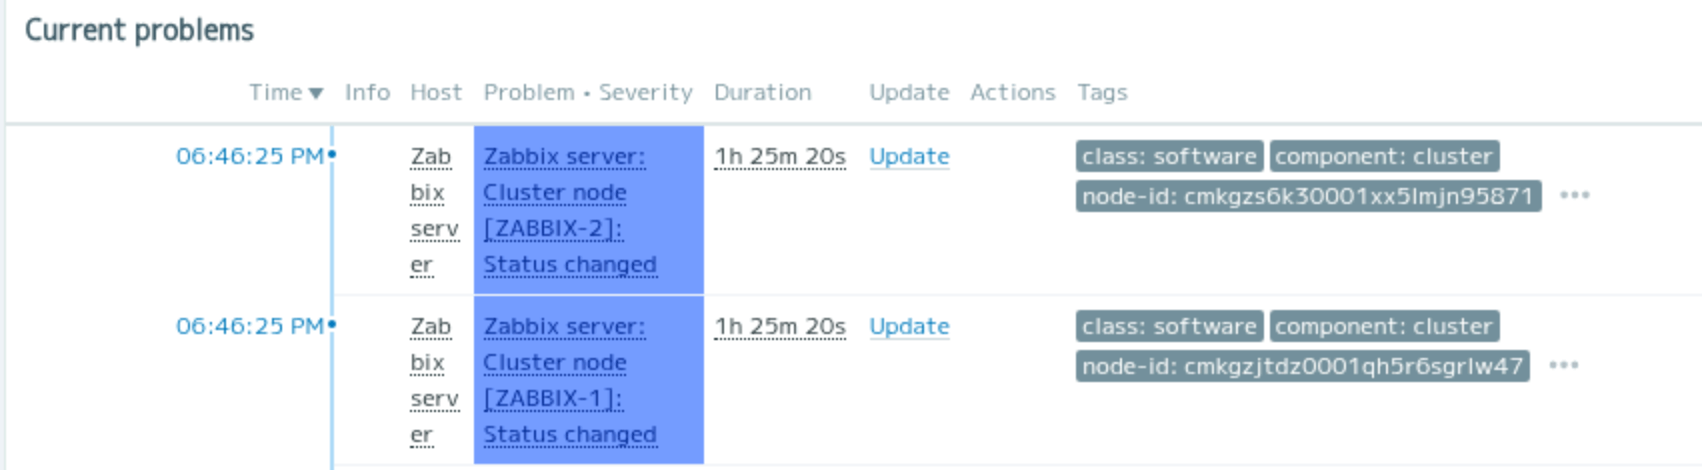
Failover Behavior During Testing

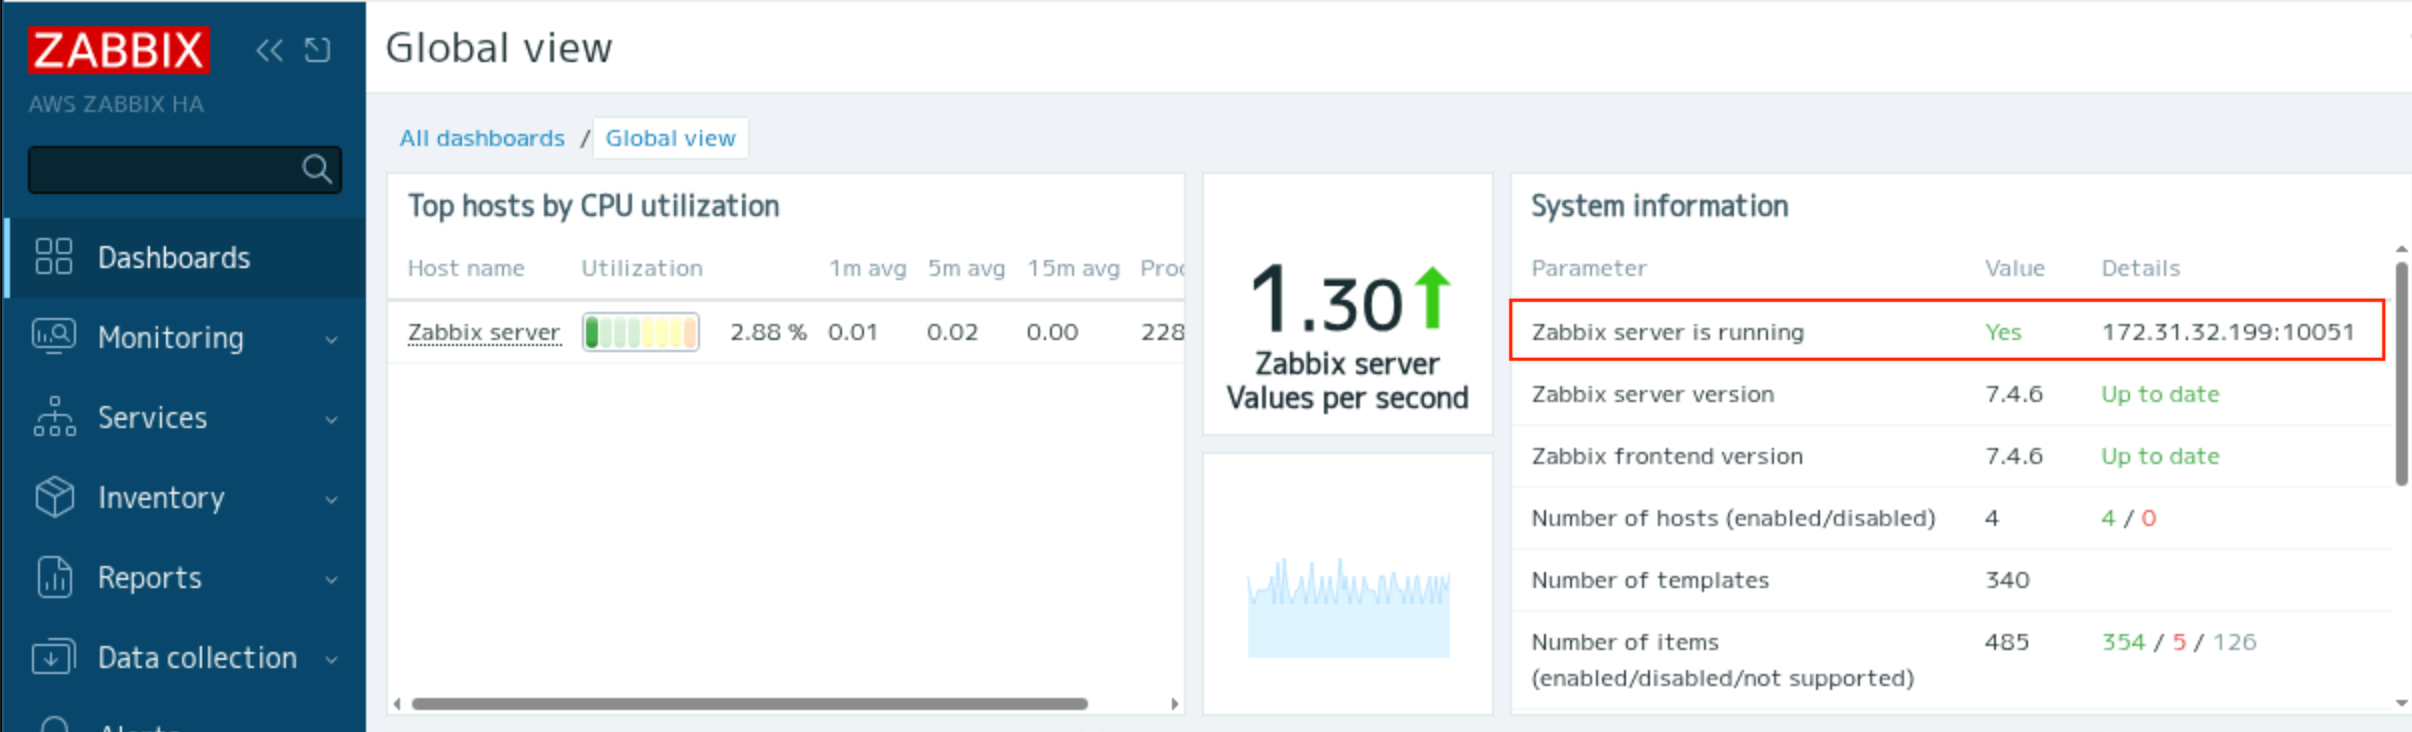
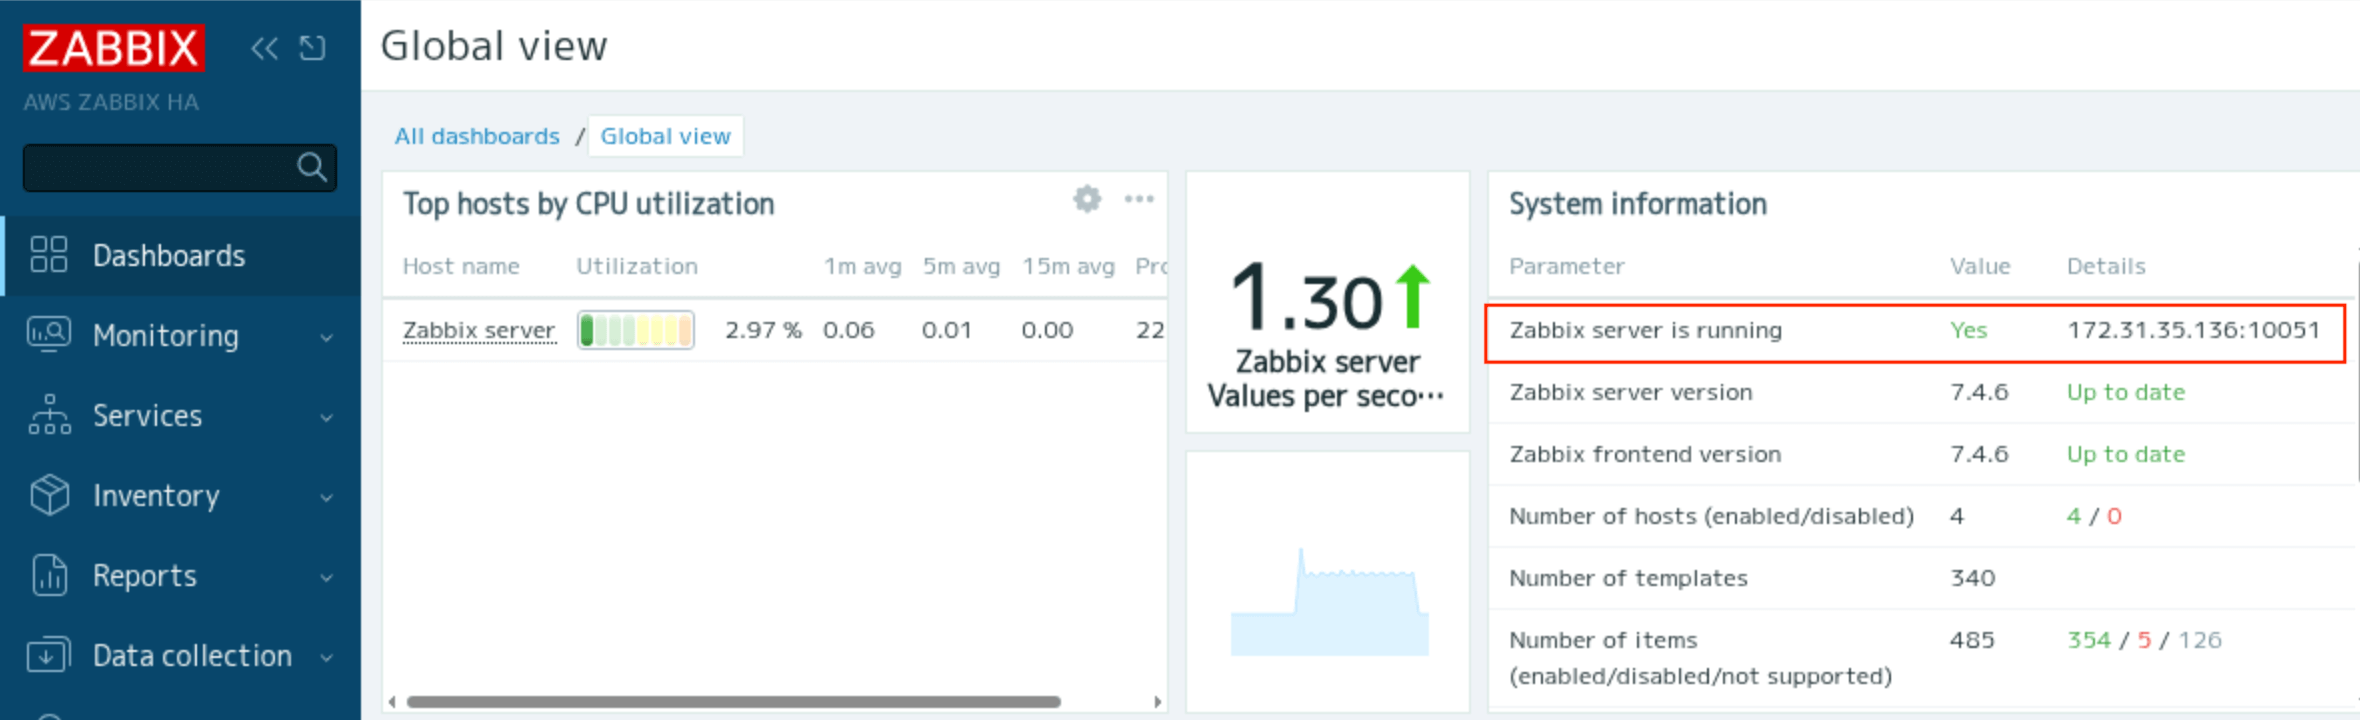
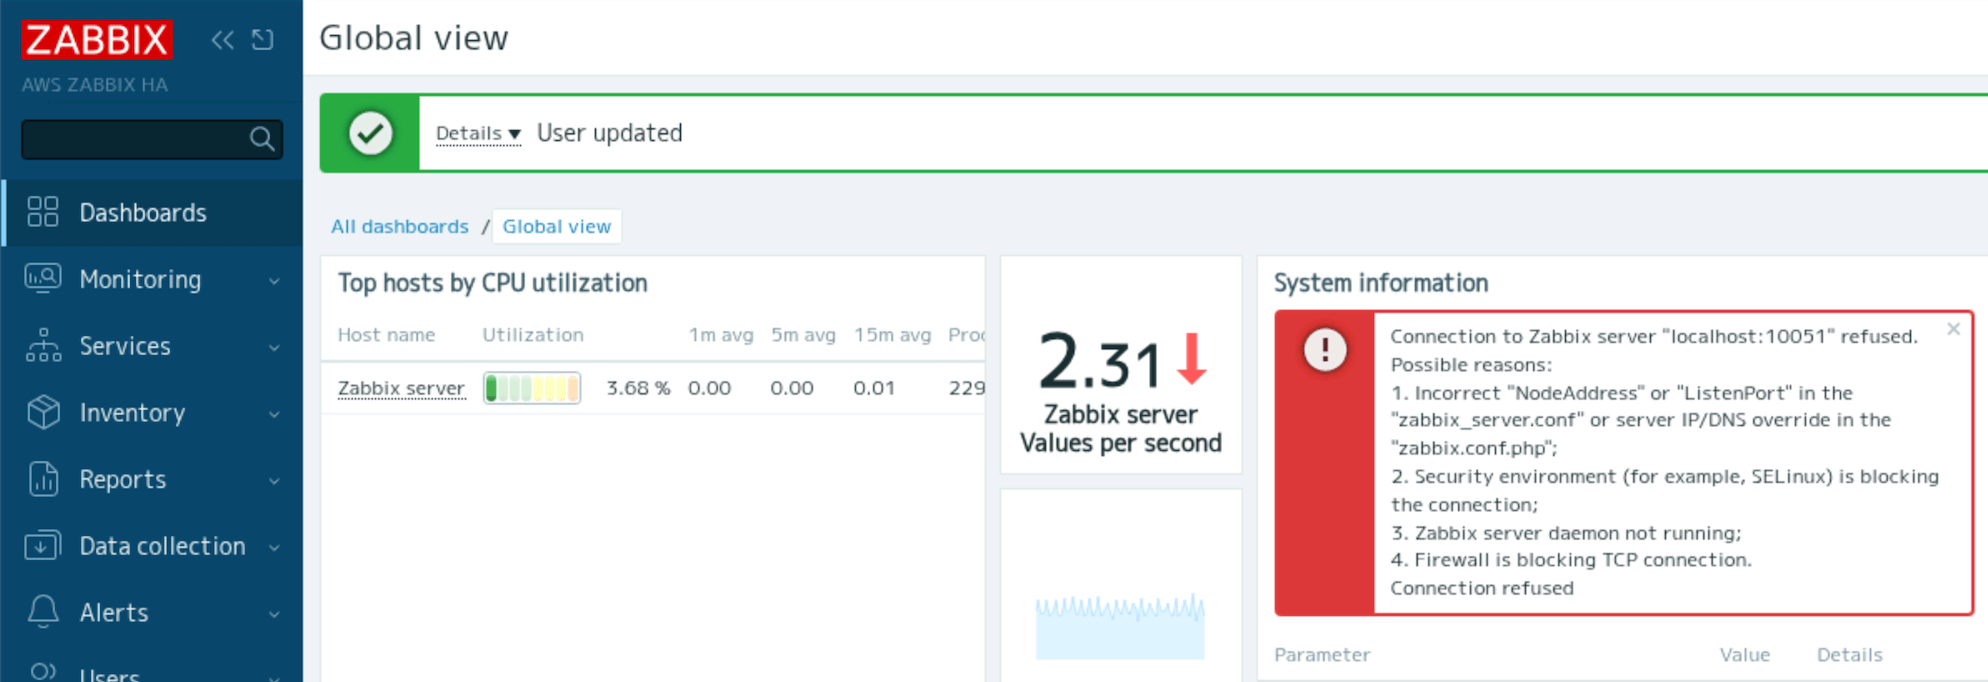
The address of the active node is displayed in System Information on the dashboard.
In the above example, the address of the ZABBIX-1 node is displayed as the Zabbix server is running.

You can check the cluster status from Dashboard > Reports > System Information.

Check the zabbix-server process

[rocky@ZABBIX-1 ~]$ sudo systemctl status zabbix-server
● zabbix-server.service -- Zabbix Server
Loaded: loaded (/usr/lib/systemd/system/zabbix-server.service; enabled; preset: disabled)
Active: active (running) since Sat 2026-01-17 00:13:38 JST; 18h ago
Process: 1778650 ExecStart=/usr/sbin/zabbix_server -c $CONFFILE (code=exited, status=0/SUCCESS)
Main PID: 1778652 (zabbix_server)
Tasks: 77 (limit: 10854)
Memory: 80.8M
CPU: 13.539s
CGroup: /system.slice/zabbix-server.service
├─1778652 /usr/sbin/zabbix_server -c /etc/zabbix/zabbix_server.conf
├─1778653 “/usr/sbin/zabbix_server: ha manager”
├─2325604 “/usr/sbin/zabbix_server: service manager #1 [processed 0 events, updated 0 event tags, deleted 0 problems, synced 0 service updates, idle 5.005355 sec du>
├─2325605 “/usr/sbin/zabbix_server: configuration syncer [synced configuration in 0.034075 sec, idle 10 sec]”
├─2325616 “/usr/sbin/zabbix_server: alert manager #1 [sent 0, failed 0 alerts, idle 5.008558 sec during 5.008641 sec]”
├─2325617 “/usr/sbin/zabbix_server: alerter #1 started”
├─2325618 “/usr/sbin/zabbix_server: alerter #2 started”
├─2325619 “/usr/sbin/zabbix_server: alerter #3 started”
├─2325620 “/usr/sbin/zabbix_server: preprocessing manager #1 [queued 4, processed 6 values, idle 5.140854 sec during 5.141074 sec]”
├─2325621 “/usr/sbin/zabbix_server: lld manager #1 [processed 1 LLD rules, idle 5.073331sec during 5.073437 sec]”
├─2325622 “/usr/sbin/zabbix_server: lld worker #1 [processed 1 LLD rules, idle 6.143254 sec during 6.143281 sec]”
├─2325623 “/usr/sbin/zabbix_server: lld worker #2 [processed 1 LLD rules, idle 6.144192 sec during 6.144217 sec]”
├─2325624 “/usr/sbin/zabbix_server: housekeeper [startup idle for 30 minutes]”
├─2325625 “/usr/sbin/zabbix_server: timer #1 [updated 0 hosts, suppressed 0 events in 0.006753 sec, idle 59 sec]“
├─2325626 “/usr/sbin/zabbix_server: http poller #1 [got 0 values in 0.000016 sec, idle 5 sec]”
├─2325627 “/usr/sbin/zabbix_server: browser poller #1 [got 0 values in 0.000009 sec, idle 5 sec]”
├─2325628 “/usr/sbin/zabbix_server: discovery manager #1 [processing 0 rules, 0 unsaved checks]”
├─2325629 “/usr/sbin/zabbix_server: history syncer #1 [processed 2 values, 2+0 triggers in 0.008062 (0.007,0.000,0.000,0.000,0.000) sec, idle 1 sec]”
├─2325630 “/usr/sbin/zabbix_server: history syncer #2 [processed 0 values, 0+0 triggers in 0.000028 (0.000,0.000,0.000,0.000,0.000) sec, idle 1 sec]”
├─2325631 “/usr/sbin/zabbix_server: history syncer #3 [processed 0 values, 0+0 triggers in 0.000024 (0.000,0.000,0.000,0.000,0.000) sec, idle 1 sec]”
├─2325632 “/usr/sbin/zabbix_server: history syncer #4 [processed 0 values, 0+0 triggers in 0.000022 (0.000,0.000,0.000,0.000,0.000) sec, idle 1 sec]”
├─2325633 “/usr/sbin/zabbix_server: escalator #1 [processed 0 escalations in 0.002945 sec, idle 3 sec]”
├─2325634 “/usr/sbin/zabbix_server: proxy poller #1 [exchanged data with 0 proxies in 0.000010 sec, idle 5 sec]”
├─2325635 “/usr/sbin/zabbix_server: self-monitoring [processed data in 0.000015 sec, idle 1 sec]”
├─2325636 “/usr/sbin/zabbix_server: task manager [processed 0 task(s) in 0.000879 sec, idle 5 sec]”
├─2325637 “/usr/sbin/zabbix_server: poller #1 [got 0 values in 0.000027 sec, idle 5 sec]”
├─2325638 “/usr/sbin/zabbix_server: poller #2 [got 0 values in 0.000027 sec, idle 5 sec]”
├─2325639 “/usr/sbin/zabbix_server: poller #3 [got 0 values in 0.000019 sec, idle 5 sec]”
├─2325640 “/usr/sbin/zabbix_server: poller #4 [got 0 values in 0.000028 sec, idle 5 sec]”
├─2325641 “/usr/sbin/zabbix_server: poller #5 [got 0 values in 0.000022 sec, idle 5 sec]”
├─2325642 “/usr/sbin/zabbix_server: unreachable poller #1 [got 0 values in 0.000022 sec, idle 5 sec]”
├─2325643 “/usr/sbin/zabbix_server: trapper #1 [processed data in 0.000043 sec, waiting for connection]”
lines 1-41

On the active node(ZABBIX-1), many processes are running as zabbix-server.

[rocky@ZABBIX-2 ~]$ sudo systemctl status zabbix-server
● zabbix-server.service -- Zabbix Server
Loaded: loaded (/usr/lib/systemd/system/zabbix-server.service; disabled; preset: disabled)
Active: active (running) since Sat 2026-01-17 09:45:57 UTC; 22min ago
Process: 19680 ExecStart=/usr/sbin/zabbix_server -c $CONFFILE (code=exited, status=0/SUCCESS)
Main PID: 19682 (zabbix_server)
Tasks: 2 (limit: 10864)
Memory: 3.1M
CPU: 248ms
CGroup: /system.slice/zabbix-server.service
├─19682 /usr/sbin/zabbix_server -c /etc/zabbix/zabbix_server.conf
└─19683 “/usr/sbin/zabbix_server: ha manager”
Jan 17 09:45:57 ip-172-31-35-136.ap-northeast-1.compute.internal systemd[1]: Starting Zabbix Server…
Jan 17 09:45:57 ip-172-31-35-136.ap-northeast-1.compute.internal systemd[1]: Started Zabbix Server.

On the standby node(ZABBIX-2), only the main process and the “ha manager” process are running.

Failover

Active Node Failure

[rocky@ZABBIX-1 ~]$ sudo systemctl stop zabbix-server

Stop the zabbix-server service on the Active node (ZABBIX-1).

Standby Node Behavior

[rocky@ZABBIX-2 ~]$ sudo systemctl status zabbix-server
● zabbix-server.service -- Zabbix Server
Loaded: loaded (/usr/lib/systemd/system/zabbix-server.service; disabled; preset: disabled)
Active: active (running) since Sat 2026-01-17 09:45:57 UTC; 35min ago
Process: 19680 ExecStart=/usr/sbin/zabbix_server -c $CONFFILE (code=exited, status=0/SUCCESS)
Main PID: 19682 (zabbix_server)
Tasks: 77 (limit: 10864)
Memory: 62.2M
CPU: 599ms
CGroup: /system.slice/zabbix-server.service
├─19682 /usr/sbin/zabbix_server -c /etc/zabbix/zabbix_server.conf
├─19683 “/usr/sbin/zabbix_server: ha manager”
├─19744 “/usr/sbin/zabbix_server: service manager #1 started”
├─19745 “/usr/sbin/zabbix_server: configuration syncer [synced configuration in 1.246509 sec, idle 10 sec]”
├─19749 “/usr/sbin/zabbix_server: alert manager #1 started”
├─19750 “/usr/sbin/zabbix_server: alerter #1 started”
├─19751 “/usr/sbin/zabbix_server: alerter #2 started”
├─19752 “/usr/sbin/zabbix_server: alerter #3 started”
├─19753 “/usr/sbin/zabbix_server: preprocessing manager #1 started”
├─19754 “/usr/sbin/zabbix_server: lld manager #1 started”
├─19755 “/usr/sbin/zabbix_server: lld worker #1 started”
├─19756 “/usr/sbin/zabbix_server: lld worker #2 started”
├─19757 “/usr/sbin/zabbix_server: housekeeper [startup idle for 30 minutes]”
├─19758 “/usr/sbin/zabbix_server: timer #1 [updated 0 hosts, suppressed 0 events in 0.008684 sec, idle 17 sec]“
├─19759 “/usr/sbin/zabbix_server: http poller #1 [got 0 values in 0.000055 sec, idle 5 sec]”
├─19760 “/usr/sbin/zabbix_server: browser poller #1 [got 0 values in 0.000033 sec, idle 5 sec]”
├─19761 “/usr/sbin/zabbix_server: discovery manager #1 [processing 0 rules, 0 unsaved checks]”
├─19762 “/usr/sbin/zabbix_server: history syncer #1 [processed 0 values, 0+0 triggers in 0.000018 (0.000,0.000,0.000,0.000,0.000) sec, idle 1 sec]”
├─19763 “/usr/sbin/zabbix_server: history syncer #2 [processed 2 values, 2+0 triggers in 0.010484 (0.007,0.000,0.000,0.003,0.001) sec, idle 1 sec]”
├─19764 “/usr/sbin/zabbix_server: history syncer #3 [processed 0 values, 0+0 triggers in 0.000019 (0.000,0.000,0.000,0.000,0.000) sec, idle 1 sec]”
├─19765 “/usr/sbin/zabbix_server: history syncer #4 [processed 0 values, 0+0 triggers in 0.000018 (0.000,0.000,0.000,0.000,0.000) sec, idle 1 sec]”
├─19766 “/usr/sbin/zabbix_server: escalator #1 [processed 0 escalations in 0.003067 sec, idle 3 sec]”
├─19767 “/usr/sbin/zabbix_server: proxy poller #1 [exchanged data with 0 proxies in 0.000054 sec, idle 5 sec]”
├─19768 “/usr/sbin/zabbix_server: self-monitoring [processed data in 0.000038 sec, idle 1 sec]”
├─19769 “/usr/sbin/zabbix_server: task manager [started, idle 3 sec]”
├─19770 “/usr/sbin/zabbix_server: poller #1 [got 0 values in 0.000036 sec, idle 2 sec]”
├─19771 “/usr/sbin/zabbix_server: poller #2 [got 0 values in 0.000038 sec, idle 2 sec]”
├─19772 “/usr/sbin/zabbix_server: poller #3 [got 0 values in 0.000036 sec, idle 2 sec]”

The ZABBIX-2 node has transitioned to Active and many processes are running.

Web Frontend View During Failover

The zabbix server address on the dashboard has changed to the ZABBIX-2 address.

In System Information, ZABBIX-2 is Active and ZABBIX-1 is Stopped.

Failover can also occur by restarting zabbix-server service on the active node.
In that case, the status will change on both nodes as shown above.

[rocky@ZABBIX-1 ~]$ sudo zabbix_server -R ha_status
Failover delay: 60 seconds
Cluster status:
ID                           Name       Address              Status     Last Access
1. cmkgzjtdz0001qh5r6sgrlw47   ZABBIX-1   172.31.32.199:10051  active      4s
2. cmkgzs6k30001xx5lmjn95871   ZABBIX-2   172.31.35.136:10051  standby     4s

You can also check the cluster status with the “zabbix_server -R ha_status” command.

I confirmed that data could be continuously get from the monitored hosts before and after the zabbix-server failover.

“Zabbix server is running”

At first, I configured one web server and one ZABBIX server without HA. In this case, I had to set the address and port of the ZABBIX server in /etc/zabbix/web/zabbix.conf.php

ZBX_SERVER                  = ‘172.31.32.199’;
ZBX_SERVER_PORT             = ‘10051’;

If the address is not set, an error will occur when connecting to the zabbix-server on localhost.

How Zabbix HA Works Internally

ha_node table

mysql> select * from ha_node;
+---------------------------+----------+---------------+-------+------------+--------+---------------------------+
| ha_nodeid                 | name     | address       | port  | lastaccess | status | ha_sessionid              |
+---------------------------+----------+---------------+-------+------------+--------+---------------------------+
| cmkgzjtdz0001qh5r6sgrlw47 | ZABBIX-1 | 172.31.32.199 | 10051 | 1768652177 |      3 | cmki78ewg0000qx5r4i7k4lp1 |
| cmkgzs6k30001xx5lmjn95871 | ZABBIX-2 | 172.31.35.136 | 10051 | 1768652177 |      0 | cmki7f2m20000iw5lq7r70r4s |
+---------------------------+----------+---------------+-------+------------+--------+---------------------------+
2 rows in set (0.00 sec)

Zabbix HA determines node availability solely by monitoring updates to the ha_node.lastaccess field in the database.
If the active node fails to update its timestamp within the configured failover_delay, a standby node promotes itself to active.
No direct node-to-node communication is involved.

status of the node.
0 – standby;
1 – stopped manually;
2 – unavailable;
3 – active.

Zabbix HA does not rely on direct node-to-node communication.
Instead, each node independently evaluates HA state by reading
the ha_node table in the database.

/******************************************************************************
*                                                                            *
* Purpose: check for active nodes being unavailable for failover_delay       *
*          seconds, mark them unavailable and set own status to active       *
*                                                                            *
******************************************************************************/
static int ha_check_active_node(zbx_ha_info_t *info, zbx_vector_ha_node_t *nodes, int *unavailable_index,
int *ha_status, int *ha_status_change_reason)
{
int i, ret = SUCCEED;
for (i = 0; i < nodes->values_num; i++)
{
if (ZBX_NODE_STATUS_ACTIVE == nodes->values[i]->status)
{
if (‘\0’ == *nodes->values[i]->name)
{
ha_set_error(info, “found active standalone node in HA mode”);
return FAIL;
}
break;
}
}
/* 1) No active nodes -- set this node as active.                */
/* 2) This node is active -- update its status as it might have  */
/*    switched itself to standby mode in the case of prolonged  */
/*    database connection loss.                                 */
if (i == nodes->values_num || SUCCEED == zbx_cuid_compare(nodes->values[i]->ha_nodeid, info->ha_nodeid))
{
*ha_status = ZBX_NODE_STATUS_ACTIVE;
*ha_status_change_reason = ZBX_AUDIT_HA_ST_CH_REASON_NO_ACTIVE_NODES;
}
else
{
if (nodes->values[i]->lastaccess != info->lastaccess_active)
{
info->lastaccess_active = nodes->values[i]->lastaccess;
info->offline_ticks_active = 0;
}
else
info->offline_ticks_active++;
if (info->failover_delay / ZBX_HA_POLL_PERIOD < info->offline_ticks_active)
{
*unavailable_index = i;
*ha_status = ZBX_NODE_STATUS_ACTIVE;
*ha_status_change_reason = ZBX_AUDIT_HA_ST_CH_REASON_DB_CONNECTION_LOSS;
}
}
return ret;
}

Failover decision source code:
part of zabbix/src/zabbix_server/ha/ha_manager.c
https://git.zabbix.com/projects/ZBX/repos/zabbix/browse/src/zabbix_server/ha/ha_manager.c

Zabbix HA avoids split brain by using the database as the single
coordination point.
Only the node that successfully updates its HA status in the database
can become active.
Because all failover decisions and state transitions are serialized
through database transactions, simultaneous active nodes cannot occur.

zabbix-agent

/etc/zabbix/zabbix_agentd.conf
Server=172.31.32.199,172.31.35.136
ServerActive=172.31.32.199,172.31.35.136

Set both node addresses in conf.

Conclusion

Zabbix HA does not rely on VIPs or direct node-to-node communication.
Instead, availability is coordinated through the database, while
the web frontend dynamically follows the active server.

Understanding this behavior makes it clear that Zabbix HA is designed
to protect server processes — not to provide full-stack redundancy.
This distinction is essential when designing real-world Zabbix architectures.

TwitterFacebookLinkedInHatenaPocketCopy Link